
Juab County, Utah
Juab County | |
|---|---|
UTC−6 (MDT) | |
| Congressional district | 2nd |
| Website | www |
Juab County (
Juab County is part of the Provo–Orem, Utah Metropolitan Statistical Area, which is also included in the Salt Lake City–Provo–Orem, Utah Combined Statistical Area.
History
The area of future Juab County was inhabited by nomadic indigenous peoples before the
The county's boundaries were altered in 1854, 1855, and 1856. Also, in 1856 the Territory legislature, acknowledging the upcoming establishment of Nevada Territory, removed from the boundary description of Juab county all territories west of 114 degrees longitude. Further boundary adjustments were made in 1861, 1862, 1866, 1870, in 1888, and 1913. A small adjustment between Juab and Sanpete counties on March 8, 1919, created the current Juab County configuration.[4]
Early settlers in Salt Creek devoted themselves to agriculture and livestock. However, by 1869 mining of precious metals had begun in the Tintic region. Mining towns, including Diamond, Silver City, and Eureka, appeared. By 1889 it was considered one of the nation's most productive mining areas. Mining continued as the dominant economic driver through the mid-twentieth century, then subsided.[5] Salt Creek grew apace, although in 1882 the town name (and US Post Office designation) was changed to "Nephi".[6]
Politics and government
Juab has traditionally voted Republican. In only one national election since 1948 the county selected the Democratic Party candidate.
| Position | District | Name | Affiliation | First elected | |
|---|---|---|---|---|---|
Senate
|
24 | Derrin Owens | Republican | 2020[7] | |
| House of Representatives | 58 | Steven J. Lund | Republican | 2020[8] | |
| House of Representatives | 68 | Merrill Nelson | Republican | 2012[9] | |
| Board of Education | 3 | Matt Hymas | Republican | 2020[10] | |
| Year | Republican | Democratic | Third party | |||
|---|---|---|---|---|---|---|
| No. | % | No. | % | No. | % | |
| 2020 | 5,087 | 86.18% | 645 | 10.93% | 171 | 2.90% |
| 2016 | 2,827 | 66.97% | 442 | 10.47% | 952 | 22.55% |
| 2012 | 3,448 | 85.99% | 451 | 11.25% | 111 | 2.77% |
| 2008 | 2,683 | 73.19% | 741 | 20.21% | 242 | 6.60% |
| 2004 | 2,681 | 78.46% | 605 | 17.71% | 131 | 3.83% |
| 2000 | 2,023 | 72.64% | 619 | 22.23% | 143 | 5.13% |
| 1996 | 1,290 | 49.12% | 928 | 35.34% | 408 | 15.54% |
| 1992 | 1,237 | 42.73% | 823 | 28.43% | 835 | 28.84% |
| 1988 | 1,505 | 59.65% | 974 | 38.60% | 44 | 1.74% |
| 1984 | 1,902 | 67.23% | 917 | 32.41% | 10 | 0.35% |
| 1980 | 1,872 | 69.31% | 720 | 26.66% | 109 | 4.04% |
| 1976 | 1,290 | 51.58% | 1,091 | 43.62% | 120 | 4.80% |
| 1972 | 1,629 | 67.06% | 691 | 28.45% | 109 | 4.49% |
| 1968 | 1,201 | 53.95% | 907 | 40.75% | 118 | 5.30% |
| 1964 | 926 | 41.25% | 1,319 | 58.75% | 0 | 0.00% |
| 1960 | 1,203 | 50.95% | 1,158 | 49.05% | 0 | 0.00% |
| 1956 | 1,512 | 59.60% | 1,025 | 40.40% | 0 | 0.00% |
| 1952 | 1,711 | 58.72% | 1,203 | 41.28% | 0 | 0.00% |
| 1948 | 1,396 | 47.94% | 1,501 | 51.55% | 15 | 0.52% |
| 1944 | 1,192 | 44.48% | 1,483 | 55.34% | 5 | 0.19% |
| 1940 | 1,412 | 39.74% | 2,136 | 60.12% | 5 | 0.14% |
| 1936 | 1,027 | 30.41% | 2,319 | 68.67% | 31 | 0.92% |
| 1932 | 1,220 | 37.60% | 1,969 | 60.68% | 56 | 1.73% |
| 1928 | 1,557 | 47.48% | 1,714 | 52.27% | 8 | 0.24% |
| 1924 | 1,325 | 43.57% | 1,241 | 40.81% | 475 | 15.62% |
| 1920 | 1,692 | 53.12% | 1,308 | 41.07% | 185 | 5.81% |
| 1916 | 1,248 | 34.45% | 2,221 | 61.30% | 154 | 4.25% |
| 1912 | 1,171 | 35.38% | 985 | 29.76% | 1,154 | 34.86% |
| 1908 | 1,615 | 48.40% | 1,421 | 42.58% | 301 | 9.02% |
| 1904 | 1,493 | 48.32% | 1,206 | 39.03% | 391 | 12.65% |
| 1900 | 1,532 | 42.46% | 1,986 | 55.04% | 90 | 2.49% |
| 1896 | 439 | 15.68% | 2,360 | 84.32% | 0 | 0.00% |
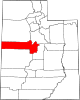
Geography
Juab County lies on the west side of Utah. Its west border abuts the east border of the state of

Airports
- Nephi Municipal Airport (NPH)
Highways[12]
Adjacent counties
- Tooele County - north
- Utah County - northeast
- Sanpete County - southeast
- Millard County - south
- White Pine County, Nevada - west
Protected areas
- Deep Creek Wildlife Management Area
- Fish Springs National Wildlife Refuge
- Fishlake National Forest (part)
- Mona Front Wildlife Management Area
- Triangle Ranch Wildlife Management Area
- Uinta-Wasatch-Cache National Forest(part)
- Yuba State Park (part)
- Yuba Lake State Recreation Area
Lakes[12]
- Andys Pond
- Antelope Springs
- Baker Hot Springs
- Big Spring
- Bittner Knoll Reservoir
- Blue Springs
- Brough Reservoir
- Burraston Ponds
- Cane Springs
- CCC Reservoir
- Cherry Creek Reservoir
- Chicken Creek Reservoir
- Coyote Knoll Reservoir
- Crater Bench Reservoir
- Dead Horse Tank
- Desert Mountain Reservoir
- Dog Valley Reservoir
- East Dugway Reservoir
- East Topaz Reservoir
- East Topaz 2 Reservoir
- Fish Springs
- Avocet Pool
- Crater Spring
- Curlew Pool
- Deadman Spring
- Egret Pool
- Gadwall Pool
- Harrison Pool
- House Springs
- Ibis Pool
- Lost Spring
- Mallard Pool
- Middle Spring
- Mirror Spring
- North Springs
- Percy Spring
- Pintail Pool
- Shoveler Pool
- South Springs
- Thomas Springs
- Walter Spring
- Hogback Reservoir
- Hole in Rock Reservoir
- Hole-in-the-Wall Reservoir
- Irons Reservoir
- Laird Spring
- Lime Spring
- Little Red Cedar Spring
- Lower Topaz Reservoir
- Mile Pond
- Molten Spring
- Mona Reservoir
- Monument Reservoir
- Mud Lake Reservoir
- Mud Springs
- North Sugarville Reservoir
- Picture Rock Reservoir
- Picture Rock Wash Reservoir
- Rain Lake
- River Bed Reservoir
- River Bed Reservoir Number 2
- Roadside Reservoir (near Boyd Station)
- Roadside Reservoir (in the Tule Valley)
- South Desert Mountain Reservoir
- Studhorse Springs
- Swasey Point Reservoir
- Table Knoll Reservoir
- Trough Spring
- West Fork Reservoir
- Yuba Lake (or Sevier Bridge Reservoir)(partially)
| Census | Pop. | Note | %± |
|---|---|---|---|
| 1860 | 672 | — | |
| 1870 | 2,034 | 202.7% | |
| 1880 | 3,474 | 70.8% | |
| 1890 | 5,582 | 60.7% | |
| 1900 | 10,082 | 80.6% | |
| 1910 | 10,702 | 6.1% | |
| 1920 | 9,871 | −7.8% | |
| 1930 | 8,605 | −12.8% | |
| 1940 | 7,392 | −14.1% | |
| 1950 | 5,981 | −19.1% | |
| 1960 | 4,597 | −23.1% | |
| 1970 | 4,574 | −0.5% | |
| 1980 | 5,530 | 20.9% | |
| 1990 | 5,817 | 5.2% | |
| 2000 | 8,238 | 41.6% | |
| 2010 | 10,246 | 24.4% | |
| 2020 | 11,786 | 15.0% | |
| US Decennial Census[16] 1790–1960[17] 1900–1990[18] 1990–2000[19] 2010[20] 2020[21] | |||
Demographics
As of July 1, 2018,
In 2010,[24] there were 3,093 households, out of which 47.8% had children under the age of 18 living with them, 68.50% were married couples living together, 8.80% had a female householder with no husband present, and 19.40% were non-families. 17.30% of all households, the householder lived alone. The average household size was 3.27, and the average family size was 3.74.
The county population contained 40.1% of 19 and younger, 5.0% from 20 to 24, 24.80% from 25 to 44, 20.1% from 45 to 64, and 10.2% who were 65 years of age or older. The median age was 29.3 years. 51% of the population was male, and 49% was female.

The median income for a household in the county was $56,976. The
Education
Two school districts serve the county:
- Juab School District, serving the Juab Valley area on the eastern end of the county
- Tintic School District, serving the remaining western part of the county
Communities[12]

Cities
Towns
Unincorporated communities
Ghost towns
See also
References
- ^ "Juab County, Utah". United States Census Bureau. Retrieved June 30, 2023.
- ^ "Find a County". National Association of Counties. Archived from the original on May 31, 2011. Retrieved June 7, 2011.
- ^ Salt Creek Google Maps (accessed 28 March 2019)
- ^ "[[Newberry Library]] Individual County Chronologies/Juab County UT (accessed March 28, 2019)". Archived from the original on March 6, 2016. Retrieved March 28, 2019.
- ^ "About Us" - Juab County UT" (accessed 28 March 2019)
- ^ County Post Offices: Salt Creek (1851-1882), Nephi (1882- ) (accessed 28 March 2019)
- ^ "Senator Owens Utah Senate". senate.utah.gov. Retrieved November 16, 2021.
- ^ "Rep. Lund, Steven J." Utah House of Representatives. Retrieved November 17, 2021.
- ^ "Rep. Nelson, Merrill F." Utah House of Representatives. Archived from the original on November 15, 2021. Retrieved November 15, 2021.
- ^ "Matt Hymas". www.schools.utah.gov. Retrieved November 16, 2021.
- ^ Leip, David. "Atlas of US Presidential Elections". uselectionatlas.org. Retrieved March 31, 2018.
- ^ a b c d Juab County UT Google Maps (accessed 28 March 2019)
- ^ Mount Ibapah, Juab County UT Google Maps (accessed 28 March 2019)
- ^ "Utah County High Points/Juab County. Peakbagger (accessed 28 March 2019)". Archived from the original on March 27, 2019. Retrieved March 28, 2019.
- ^ "2010 Census Gazetteer Files". census.gov. US Census Bureau. August 22, 2012. Retrieved June 25, 2015.
- ^ "US Decennial Census". census.gov. US Census Bureau. Retrieved June 25, 2015.
- ^ "Historical Census Browser". lib.virginia.edu. University of Virginia Library. Retrieved June 25, 2015.
- ^ Forstall, Richard L., ed. (June 25, 1995). "Population of Counties by Decennial Census: 1900 to 1990". census.gov. US Census Bureau. Retrieved March 27, 2015.
- ^ "Census 2000 PHC-T-4. Ranking Tables for Counties: 1990 and 2000" (PDF). census.gov. US Census Bureau. April 2, 2001. Retrieved June 25, 2015.
- ^ "State & County QuickFacts". United States Census Bureau. Archived from the original on June 6, 2011. Retrieved December 29, 2013 – via Wayback Machine.
- ^ 2020 Population and Housing State Data | Utah
- ^ "Bachelor's degree or higher, percent of persons age 25 years+, 2010–2014". census.gov. US Census Bureau. Retrieved April 21, 2016.
- ^ "Juab County UT Demographics data". towncharts.com. Retrieved April 21, 2016.
- ^ "U.S. Census website". United States Census Bureau. Retrieved April 22, 2016 – via Wayback Machine.
Further reading
- (1994) "Juab County" article in the Utah History Encyclopedia. The article was written by Philip F. Notarianni and the Encyclopedia was published by the University of Utah Press. ISBN 9780874804256. Archived from the original on March 21, 2024 and retrieved on May 20, 2024.
External links
- Juab County website
- Juab County Fair website
- Juab County Sheriff's Office website
- Juab Travel Council website
- Ghost Towns of Juab County (on ghosttowns.com)
Places adjacent to Juab County, Utah | |
|---|---|
 | ||||
Towns | ||||
| Unincorporated communities | ||||
| Ghost towns | ||||
| Indian reservation | ||||
| Footnotes | ‡This populated place also has portions in an adjacent county or counties | |||
| ||||
| International | |
|---|---|
| National | |